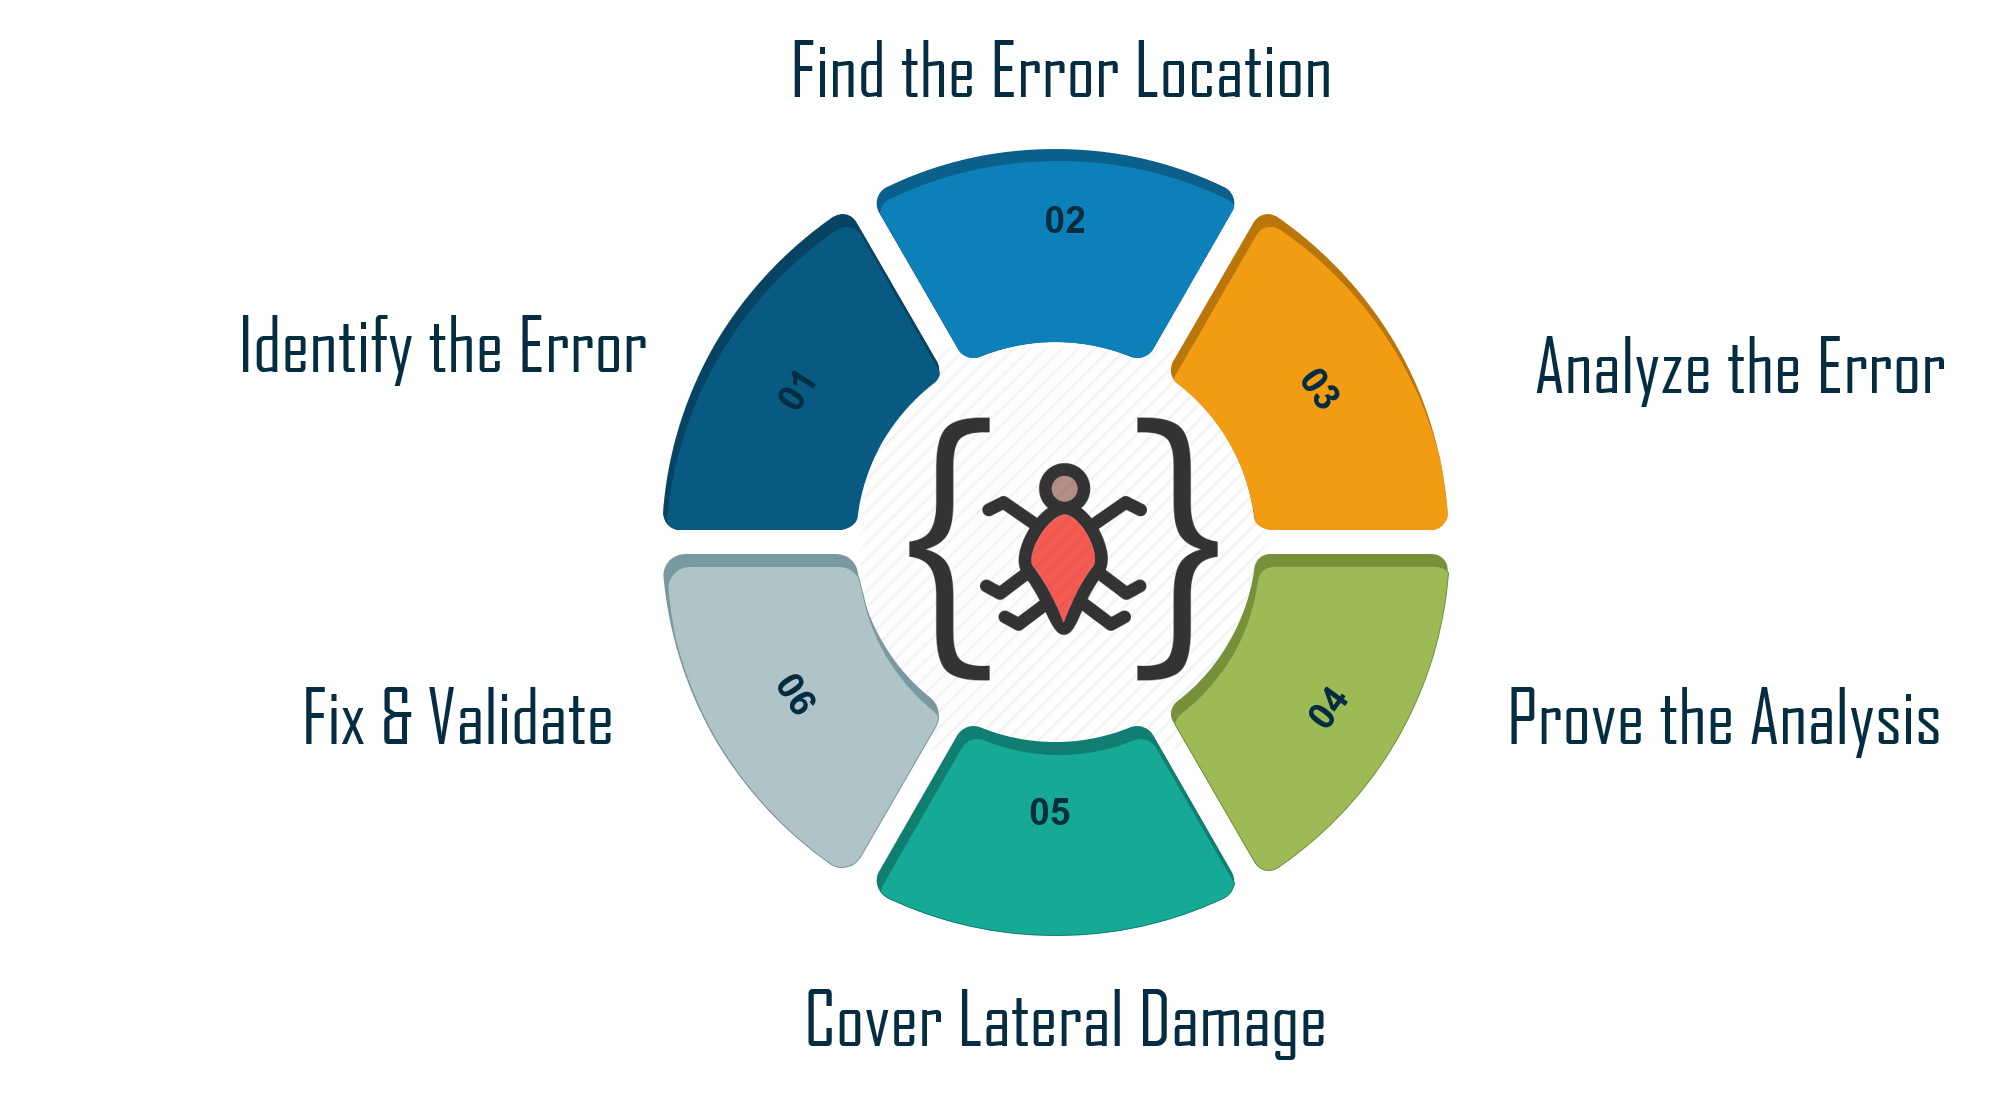
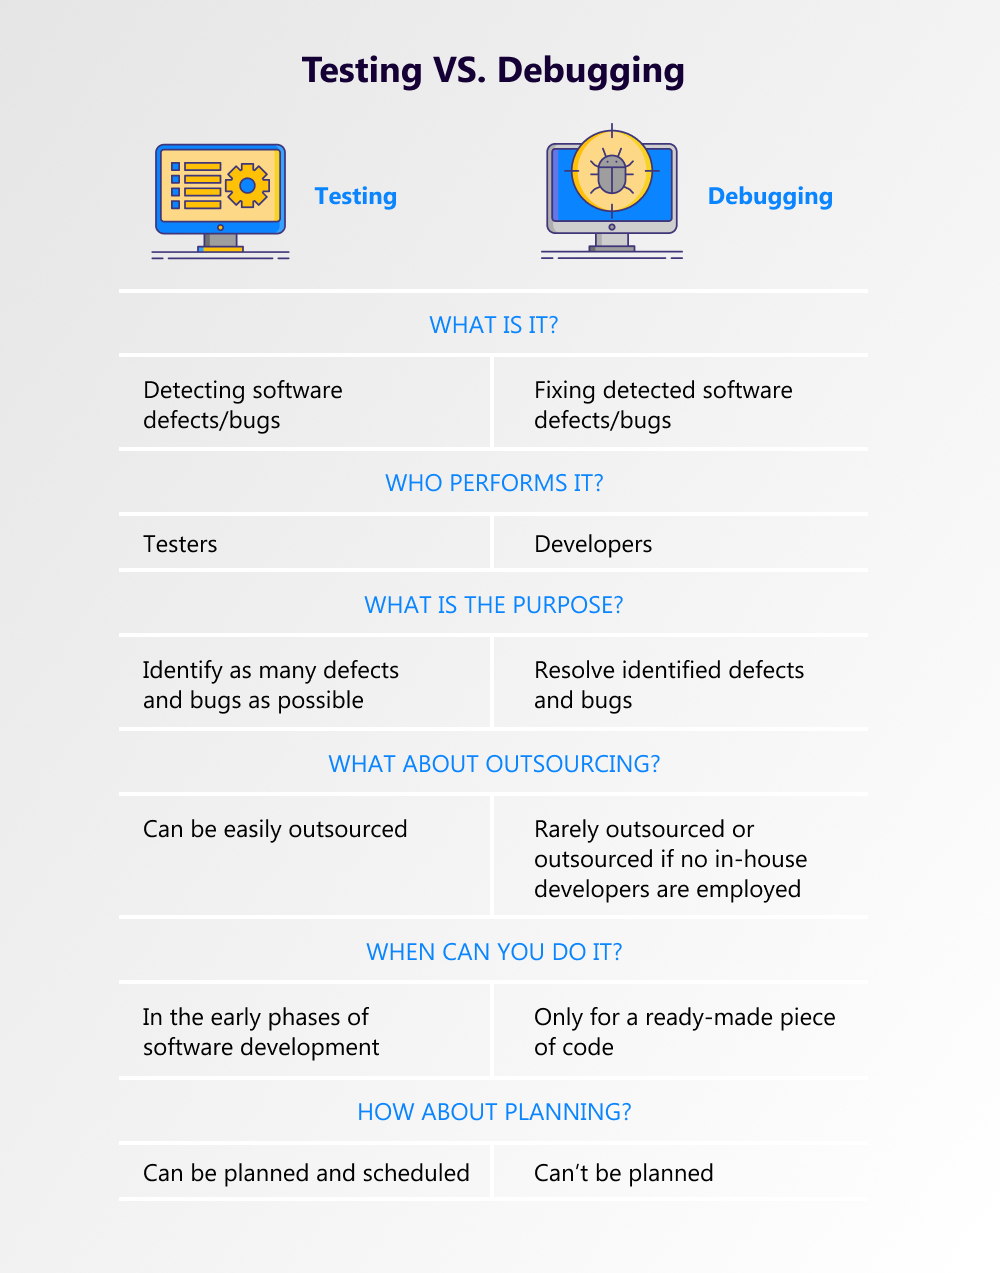
Testing and debugging are crucial aspects of the software development process. They help ensure the reliability, functionality, and security of a software application. Here's an overview of testing and debugging in the context of full-stack development:
Testing:
1. Types of Testing:
Unit Testing:
- Focuses on testing individual units or components of the code in isolation. It helps ensure that each unit works as intended.
Integration Testing:
- Involves testing the interactions between different components or systems to ensure they work together seamlessly.
Functional Testing:
- Validates that the software functions according to the specified requirements and behaves as expected.
End-to-End (E2E) Testing:
- Tests the entire application workflow from start to finish, simulating real user scenarios.
Performance Testing:
- Checks the performance and responsiveness of the application under various conditions, such as high loads or concurrent users.
Security Testing:
Identifies vulnerabilities and weaknesses in the application's security measures to prevent potential security breaches.

2. Testing Tools:
Frontend Testing Tools:
- For JavaScript-based applications, tools like Jest, Mocha, and Cypress are commonly used for unit testing, integration testing, and E2E testing.
Backend Testing Tools:
- Frameworks like JUnit (for Java), PyTest (for Python), and Mocha (for Node.js) are popular for backend unit testing.
API Testing Tools:
- Tools like Postman, Insomnia, and Swagger can be used to test and document APIs.
Performance Testing Tools:
- Tools like Apache JMeter, Gatling, and Locust help simulate various scenarios to test the performance of the application.
3. Test Automation:
Automate repetitive and time-consuming test cases to ensure efficient and consistent testing.
Continuous Integration (CI) tools like Jenkins, Travis CI, or GitHub Actions can be integrated to automatically run tests on code changes.
Debugging:
1. Debugging Tools:
Browser Developer Tools:
- For frontend debugging, browsers provide built-in developer tools (e.g., Chrome DevTools) for inspecting and debugging HTML, CSS, and JavaScript.
IDE Debugging Tools:
- Integrated Development Environments (IDEs) offer debugging tools for server-side languages, allowing developers to set breakpoints, inspect variables, and step through code.
2. Logging:
Include meaningful log statements in the code to track the flow of execution and identify potential issues.
Utilize logging frameworks or libraries to generate logs with varying levels of severity (e.g., DEBUG, INFO, ERROR).
3. Code Reviews:
Conduct regular code reviews to catch potential issues early in the development process.
Collaborate with team members to share insights and identify improvements in the codebase.
4. Error Tracking:
Implement error tracking tools (e.g., Sentry, Rollbar) to automatically capture and log errors in production.
Receive notifications and detailed error reports to quickly address issues.

Best Practices:
Test Early and Often:
- Start testing as early as possible in the development process to catch issues before they become more challenging to address.
Isolate Issues:
- Use a systematic approach to isolate and identify the root cause of issues during debugging.
Regression Testing:
- Regularly perform regression testing to ensure that new changes don't introduce unexpected issues in existing functionality.
Collaboration:
- Foster a collaborative environment where developers, testers, and other stakeholders work together to identify and resolve issues.
Continuous Improvement:
- Learn from testing and debugging experiences to continuously improve coding practices, testing strategies, and development workflows.
By incorporating thorough testing practices and effective debugging strategies, developers can enhance the overall quality and reliability of their software applications.
Difference


